Parametric Analysis
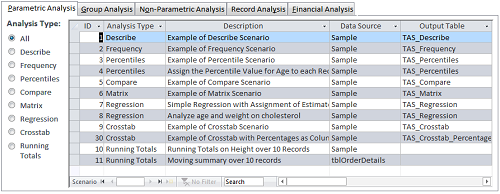
The Parametric Analysis features are available when you select the [Parametric Analysis] tab from the main form:

Describe: Analyze a numeric field: standard deviation, standard error, variance, coefficient of variance, skewness, kurtosis, geometric mean, harmonic mean, RMS, mode, confidence intervals, t-Test vs. mean, percentiles, etc.
Frequency: For each field, analyze frequency distribution for each interval (range of values): count, sum, percent of total, cumulative count, percent, and sum.
Percentiles: Perform analysis similar to Describe, but can place results in records rather than in fields (each percentile is a separate record) and/or update a field in your table with the record's percentile value.
Compare: Compare two fields: mean and standard deviation of difference, correlation, covariance, R-square, paired t-Test.
Matrix: Perform analysis similar to Compare, but rather than comparing several fields to one, compare all fields to each other creating a matrix.
Regression: Calculate simple, multiple, and polynomial regressions with ANOVA and residual table.
Crosstab: Create cross-tabulation with row and column summaries, and % of row, column, and total for each cell. Chi-Square analysis is also available with expected value and % of expected for each cell.
Running Totals: Calculate running totals (sum, average, min, max, median, etc.) for a sorted list of values. Based on all or a moving number of records. Up to five fields can be updated in one pass.
