Visual Studio .NET Tips and Tricks
Provided by Dan Haught, FMS Executive Vice President
You have probably seen the Task List toolwindow in Visual Studio .NET. This window shows you a number of useful things including any known compile errors in your code. But did you know it will also show you all your bugs and undone items? Well, it doesn’t actually do this automatically, but it gives you a truly useful mechanism for tracking these items.
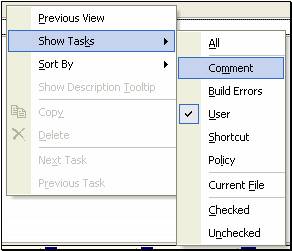
Whenever you are typing code and you know that you are about to leave something undone, simply type in a comment that starts with ‘undone’. When you do this, Visual Studio .NET can show all your undone items in the Task List toolwindow. There is one trick here: by default, the Task List is filtered to not show Comment items. To fix this, simply right-click on the task list window, and select Show Tasks, and check the Comments box. Better yet, select all so you can always see all tasks.
For example, of you put in the following comment:

Your Task List now shows the Undone comment, along with the line and column where it exists. Simply click on the item in the Task List and the code editor automatically goes to that location. But you can do more than just flag undone items. Visual Studio .NET comes with four default “tokens” you can use in your comments, including HACK, TODO, UNDONE and BUG. And you can add your own items to the list. To access these tokens, select Tools, Options, Environment, Task List.
The really truly useful part comes when you are done with a milestone on your project. You now need to review all the potential bugs and undone items. In the past, you would have gone scrambling for your yellow pad, or a notepad file (if you had the foresight to keep a list of items manually!). But with Visual Studio .NET, you simply open your Task List and click through all the items.
A truly nifty feature of the Visual Studio .NET code editor is the concept of regions. You can create named regions directly in your source code. You can then expand and collapse regions in the editor to hide or show code based on its type. For example, you could create a region called “Public Properties” and put all your property code there. Additional regions could support your public methods, and privates.
Using regions is easy simply type the #Region phrase followed by the name for your region, as in:
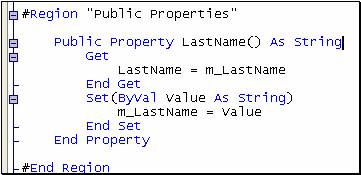
You can now expand and collapse the region by clicking on the +/- icons on the right. You can also use the keyboard to expand and collapse regions. Try Ctrl-M, M and Ctrl-M, L.
How about this? Highlight some code in the code editor. Drag the code on to the toolbox. Lo and behold, you now have a snippet of code saved. You can drag that snippet from the toolbox back on to the code editor window in any place and you code snippet is automatically inserted.
To make this feature truly useful (and to avoid cluttering up your default toolbox tabs) consider creating one or more tabs just to hold snippets. To do this, right-click on the toolbox and select Add Tab. Create a new tab and give it name to describe the type of snippet, and then drag snippets on that tab. I spent an hour or so spelunking through my local disk trying to find where Visual Studio .NET stores these items, but to no avail. Perhaps they are in some mystery binary blob, or hidden deep in the registry encoded as GUIDs. Or perhaps, they are sent off as SOAP packets to that mysterious internet “cloud” Bill Gates keeps talking about. Regardless, I would hardly use this feature as an industrial strength code repository. (What happens when you re-install Visual Studio .NET or move to another computer? Where do your snippets go?)
Finally, remember that all code repositories are potential bug factories. If you paste in buggy code and re-use it, you are cloning bugs. And this inevitably leads to fascinating new strains and variants of defects which are likely to be un-fixable.
I was programming in Visual Studio .NET for over 6 months before I discovered this one, and it is one of the most useful navigation keys there is. To “Go Back” (in other words, return to the previous position before you navigated away) simply press Ctrl-Minus. This works across windows, and the navigation buffer appears to be limitless, so this is a great replacement for the old VB Ctrl-Shift-F2.
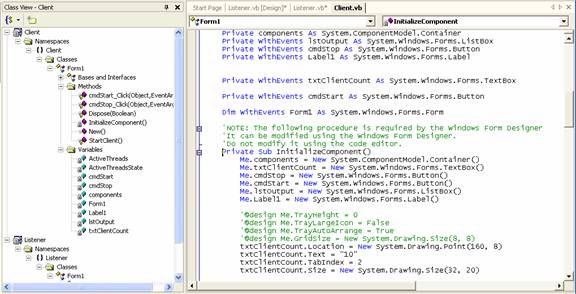
Call me slow, but after a class I’m writing reaches over 100 properties and methods, I can no longer get a quick handle on how it works. Although using Regions in code makes code expandable and collapsible, that can only go so far. One neat trick I’ve found is to dock the Class View toolwindow directly to the left of my code window. The Class View then acts as a table of contents for me as I work on the code.
If your solution View tab is becoming hard to manage because your solution has too many projects and items, consider creating folders to group items. To do this, right-click in the Solution Explorer and select Add, New Folder. You can create folders to hold user controls, HTML pages, resources, and other items. This makes navigating through a complex project much easier. You can even drag existing items into new folders which makes reorganizing existing projects much easier.
When you are working with lots of code and need to see as much as possible, or are designing a particularly large form, switch in to FullScreen mode. To do this, select View, Full Screen from the menu, or press Shift-Alt-Enter. FullScreen mode gives full screen real estate to the current design window by hiding all the toolwindows and command bars. Shift-Alt-Enter again and you’re back in regular view.
Visual Studio.NET is a festival of toolbars, menus, toolwindows, and editors. To use the IDE to its fullest potential, you really should consider working at a minimum resolution of 1280x1024. And 1600x1200 is ideal. The obvious problem with these resolutions is that text can be hard to see. Hence, you need a bigger monitor. 19 inch monitors are now cheap enough that you owe it to yourself to upgrade if you haven’t already done so. Increased productivity and coding skills are sure to follow.
Yet another keystroke that evaded me for the first six months of .NET development: Go To Definition. In the code editor, it is easy to right-click on a name and select Go To Definition, but the keystroke eluded me. Here it is. It is F12. There are hundreds of very cool key combinations in Visual Studio.NET.
You probably never noticed it before, but the innocuous little Find dropdown on the toolbar is actually a fully function command window.
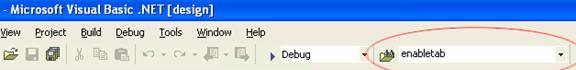
Click on the box and type the > character. Now you are in command mode. Type in any valid Visual Studio .NET command alias and press Enter. What is a Command Alias you ask?
All Visual Studio.NET help is in HTML format. That means when you view help, you are using Internet Explorer. Did you know you can change the text size on the fly to help read those particularly dense code examples? The five cent way is to right-click on the help window, and select Text Size. You can then select one of six preset text sizes. But did you know that if you have a Microsoft Mouse with a wheel, you can use the wheel? Simply click anywhere in the help window, hold down the Shift key, and wheel away. You can zoom in and out with this handy feature.
If you are like me, after about seven cups of coffee, your hands shake way to bad to use the mouse to do minute sizing and positioning of controls. Here’s a tip: use the keyboard instead. Simply highlight the control, and use Ctrl-Left/Right and Ctrl-Up/Down to resize. Of course, this isn’t new to Visual Studio .NET (You could do this in VB 6, at least I think you could), but it bears repeating.
If you are coming to Visual Studio .NET from another Microsoft IDE such as Visual Basic of VC++, you may find that the default key mappings are way to foreign for you to be productive. Although you have the chance to set default key mappings on the Start Page when Visual Studio .NET runs for the first time, you may want to change them as you work on a different machine. To do this, go to Tools, Options, Environment, Keyboard and select the scheme that most closely matches what you are used to. You can also use this dialog to map keys to commands.
Depending on your hardware, Visual Studio .NET may seem a bit sluggish compared to previous Microsoft IDEs. Here are two simple tips to make things appear a bit quicker. First, turn off that awful Dynamic Help window. When open, it steals cycles as it tries to determine which inappropriate help topics to display based on where the mouse currently is. Second, go to Tools, Options, Environment, General and turn off the Animate Environment Tools option. This option causes un-pinned toolwindows to fold in slowly. Who need’s that? When you’re three days past your deadline, you have 200 unsolved bugs, and there is too little blood in your caffeine system, that last thing you need is slow window paint effects.
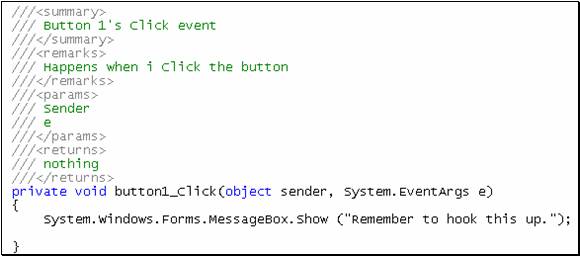
C# has the ability to be somewhat self-documenting through the use of XML Comments. You can type XML comments into your code and the Visual Studio .NET Build Code Comment Web Pages command can extract those comments, along with information from the code itself to generate basic documentation web pages.
For example, if you typed the following comments before your button1_Click member:
You then generate Comment Web Pages, and you see the following entry:
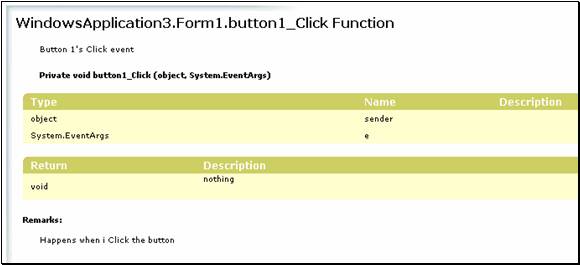
C++ has limited support for this feature, and Visual Studio .Net has no support for XML Comments. However, with Visual Studio .Net, you can still Build Code Comment Web Pages albeit without much information.
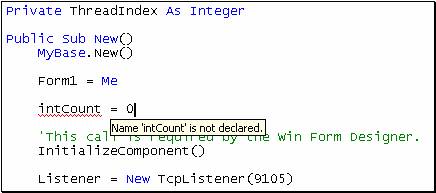
Visual Basic .NET has a background compiler that compiles your code as you type. A huge benefit of this technology is that Visual Studio .NET can show you compiler errors as you type. This benefit is truly wonderful when you remember the old Visual Basic debug cycle: compile, hit the first error, respond to the message box, fix the error, compile, and start again. With Visual Basic .NET, you can see compiler errors right way.
Compiler errors are shown as a squiggly underline in your code. The default color for this squiggly is blue, but I like compiler errors to be really noticeable. Mine show up in red (you can change this in Tools, Options, Fonts and Colors. The real interesting part happens when you hover your mouse over the offending code: it shows a tool tip explaining the error.
You can also see all compile errors in the Task List toolwindow as you type.
Connect with Us
 Email Newsletter
 Developer Team Blog
 Facebook
 X/Twitter
Additional Resources
 My FMS
Thank you! Thank you! I just finished reading this document, which was part of a link in the recent Buzz newsletter. I have printed it for others to read, especially those skeptical on the powers of Access and its capabilities.
Darren D.
 All Our Microsoft Access Products


