Statistics that Don't Lie
Industrial-strength data analysis with Total Access Statistics
By Don Kiely
Access/Office/VBA Advisor, July 1997
Copyright © Advisor Publications. All rights reserved.
One of the biggest shortcomings in Microsoft Access is the lack of industrial-strength statistical analysis tools that can be used with large recordsets. Most of the tools you need are certainly there to build your own solutions, mostly through SQL statements and VBA functions, but this takes a lot of work and is painfully slow for anything but the simplest calculations of means and regression analysis. You can always export data to Excel for number crunching, but then the OLE overhead slows down and users have to own Office.
Total Access Statistics (TAS) from FMS, Inc. offers a wide range of statistical functions for Access databases. The product is installed as an Access add-in and runs directly from your database through the Tools > Add-ins menu in Access 97. With the Statistics Wizard, you can quickly analyze your data without programming. The results are stored in Access tables, so that you can view, sort, or query the results, merge it with other data, or add it to forms and reports. It even includes a Probability Calculator, a utility that evaluates the probability of test values, eliminating the need to look up the interpolate statistical probability tables in dusty textbooks.
TAS provides an impressive variety of statistical functions you can use to analyze data, such as simple field analysis (mean, standard deviation, etc.), as well as far more esoteric functions, such as regressions, chi-square, and Kolmogorov-Smirnov Two Sample Tests. (You can find the complete list on FMS's web site.)
The functions are broken into three broad categories. Parametric Analysis is performed on numeric fields that are assumed to be continuous and normally distributed. Fields are analyzed individually or compared with each other. The second category is Group Analysis, which analyzes continuous numeric fields between groups of records. A comparison field in the table defines the groups, which may be of different sizes (number of records). The third category, Non-Parametric Analysis, is less powerful than parametric analysis, but is used when the underlying data is not continuous or not normally distributed. Non-parametric analysis makes no assumptions about the distribution of the underlying data, since the results are based on the ranks of the data. Non-parametric analysis can be made for each numeric field individually, compared with each other, or between groups of records.
Novice statisticians, beware
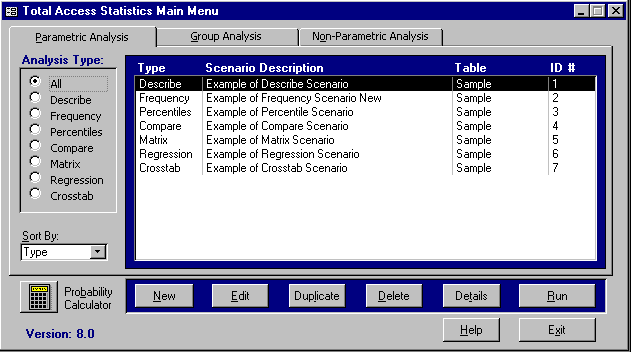
TAS won't teach you about statistics, so you have to know what you are doing to use the product effectively. But, if you are a statistician, or have one in the next cubical, TAS makes it pretty easy to crank the numbers in a recordset. Each type of analysis you design is saved as what TAS calls a scenario, grouped by the three types of analyses and groups of statistical functions (figure 1).

Total Access Statistics' friendly face - User interface provides plenty of help in designing the type of analysis you perform on a recordset. You can store scenarios for reuse or use in code.
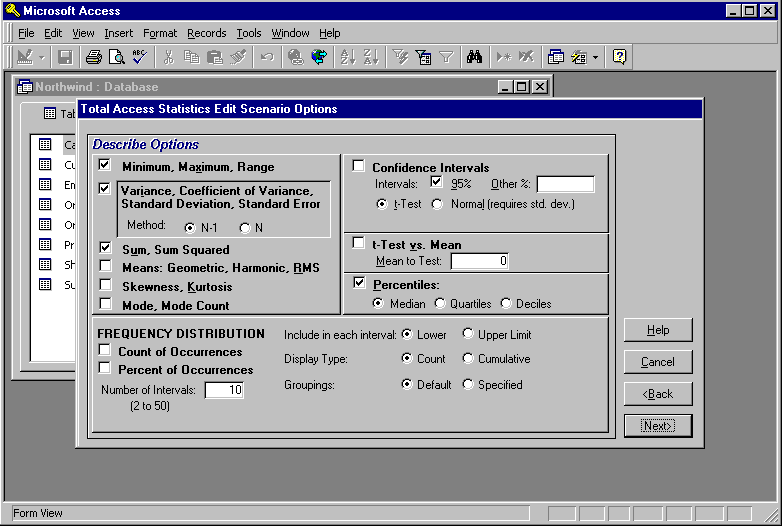
A Statistics Wizard guides you through the necessary steps to create and run your scenarios. Here's where you really need to know about statistics: While the wizard provides plenty of hand-holding to make the right selections, it contains very little in the way of statistical theory. Figure 2 shows an example of the type of screen you have to wade through -- a statistician's dream but a layman's nightmare.

TAS Statistical Wizard
- It takes you through the steps to create a scenario, helping you select the table or query, choose the specific statistics functions, and set the options for the analysis.
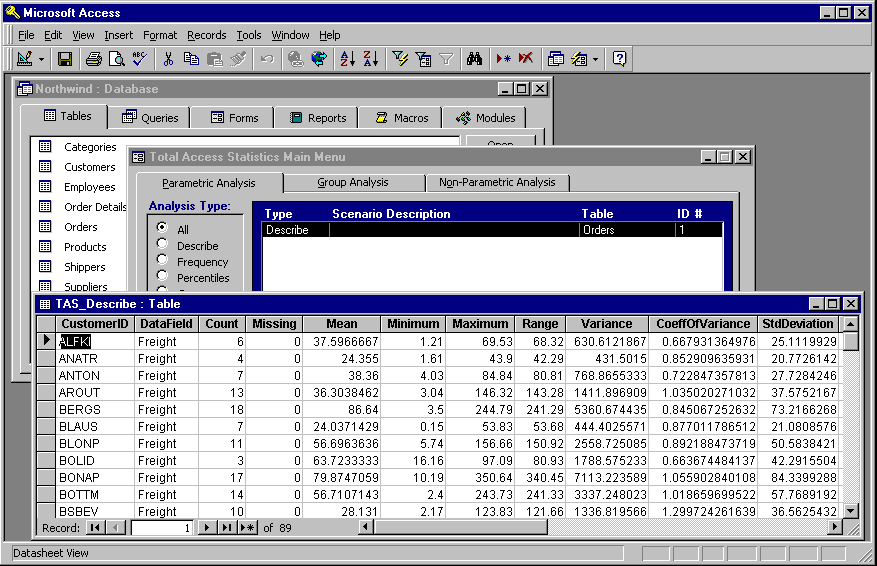
The end result of running a scenario is at least one new table in your database. TAS seems to do a good job protecting your data by taking great pains not to modify your existing tables or queries in any way. The scenarios are usually stored in system tables in the database, hidden from view -- and user tampering -- unless you make them visible. The structure and contents of a results table depends on the specific functions you select and the record grouping. The table shown below groups the various results by customer:

All the statistics you could want
- Result of a TAS analysis is a new table in your database, grouped as you specified in the scenario and containing fields for each statistical function.
TAS adds fields showing the number of records grouped and how many were missing data (it automatically ignores Nulls.) The rest of the fields to the right are the results of the functions I selected in the wizard.
TAS provides a programmatic interface so you can use its functions in your own applications, and the user doesn't have to know you're using TAS. With it, you can run any scenario you've saved in the database, so that it creates the result table, then use that table any way you like in your own application. In order to distribute TAS, you have to buy the run time version, but then you can distribute any number of applications royalty-free.
I had only one problem using TAS, that initially seemed rather serious. I tested it on several .MDB files using Access 97, and some gave me a fatal error that caused TAS to shut down: "Field 'tblTStat_TMP_SelectedFields.Field_Type' can't be a zero length string." This is a field in one of the system tables that TAS creates for its own use. I couldn't discern any pattern for the error other than it happened every time with certain database files -- no matter which table I tried to use. The error appeared in a dialog box saying that an error log file was created, allowing me to view it, and asking that I mail or fax it to FMS for analysis. About a week after I submitted the problem to them, they got back to me. It turns out that there's a problem using TAS from replicated databases when you include the GUID field (used for replication) in the analysis. The workaround is simple: Exclude that field from the analysis. They've promised to fix the problem in the next version. From this and previous experiences with FMS products, I know that they really do care about their products.
If you need this kind of statistical number crunching on your data, take a look at TAS, but test it against the database you'll use. Versions are available for Access 2.0 on Windows 3.1, and Access 95 and 97 running on either Windows 95 or NT.
Contributing writer Don Kiely is the technology czar for SkyFire Group, a company dedicated to better living through high-technology. He lives and programs in the last frontier in Alaska, writing business software, articles, and books. While fretting over database statistics.
More Total Access Statistics Awards, Reviews and Customer Testimonials
Microsoft Access 2016 and 2013 Versions are shipping!
Version 14.1 for
Microsoft Access 2010
Version X.9 for
Microsoft Access 2007 and 2003
Version X.8 for
Microsoft Access 2002, 2000, and 97
Reviews
"Total Access Statistics performs a wide range of data analysis right inside Access. The product includes a Statistics Wizard to perform parametric, group, non-parametric, record analysis and more. The results are placed in Access tables that you can integrate into your forms and reports."
Alison Balter, Author
Statistics Info
Additional Info


