 Monitoring SQL Server Usage on Microsoft Azure and Setting DTU Limits
Written by: Luke Chung, President
 Microsoft Azure lets you easily create and deploy enterprise quality SQL Server on the cloud.
Basic Plan
For only $5 a month, plus data transfer costs (Basic level), you can have
- A SQL Server database hosted in a secure facility on three mirrored hard disks
- Up to 2 GB of data with 5 DTU (Database Transaction Unit)
- Database mirroring on three separate hard disks
- Data recovery for any minute in the past 7 days
- Diagnostics to troubleshoot and recommend performance improvements
- Monitoring the level of use and demand on the database
- and much more to make it enterprise quality
Standard Plans
Standard plans start at $15 a month for up to 250 GB of data with 10 DTU, and 28 days of database recovery.
Of course, more space, DTUs and other features are available (along with pooled resources) as you scale and pay more.
What level you choose depends on how much your database stores and how intensely it's used.
Monitoring SQL Server Resources
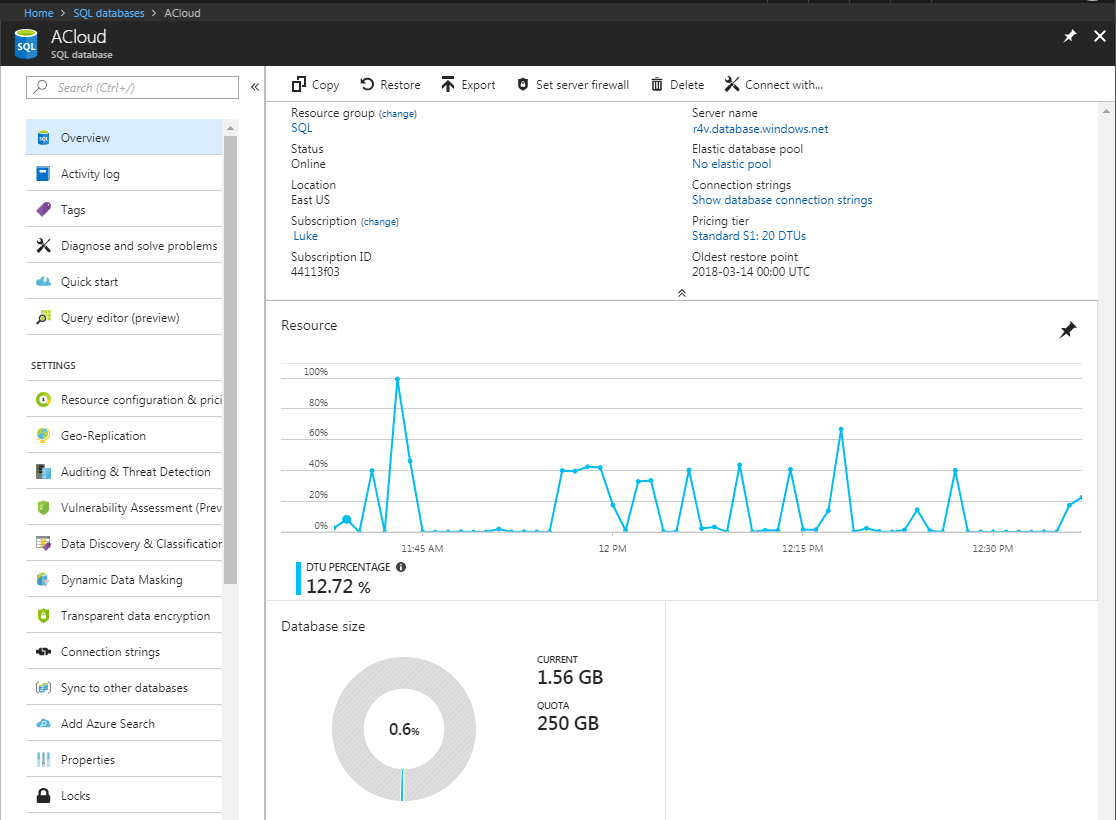
One of the features of SQL Server databases on Azure is the "Overview":
Set Metrics
From the Resource Graph, you can click on the pin to open it up in a larger screen. You can set a range of time to view the demand on your database for the past period (hour, day, week, month) or a specific date/time range. By default, the past hour appears.
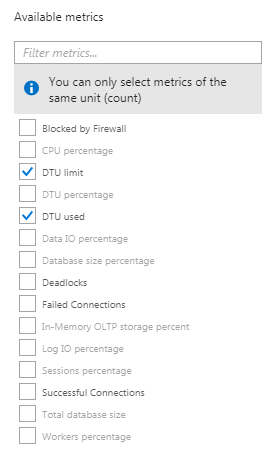
By default, the DTU Percentage is shown, but to make it clearer, we've found by unchecking that and seeing the DTU Used and DTU Limit is better if we're changing the DTU Limit.
This is set on the list of available metrics:
Weekly Monitor Seems Reasonable
We can see the DTU usage against the maximum DTU for this database. The cyan line across the top is the DTU limit. The dark blue line is the DTU used. The limit is what we pay, so it's important to make sure we scale it to what the application needs.
Looking at the activity for the past week, there are times when the usage is zero (non-business hours) with expected spikes of usage that are well below the maximum capacity.
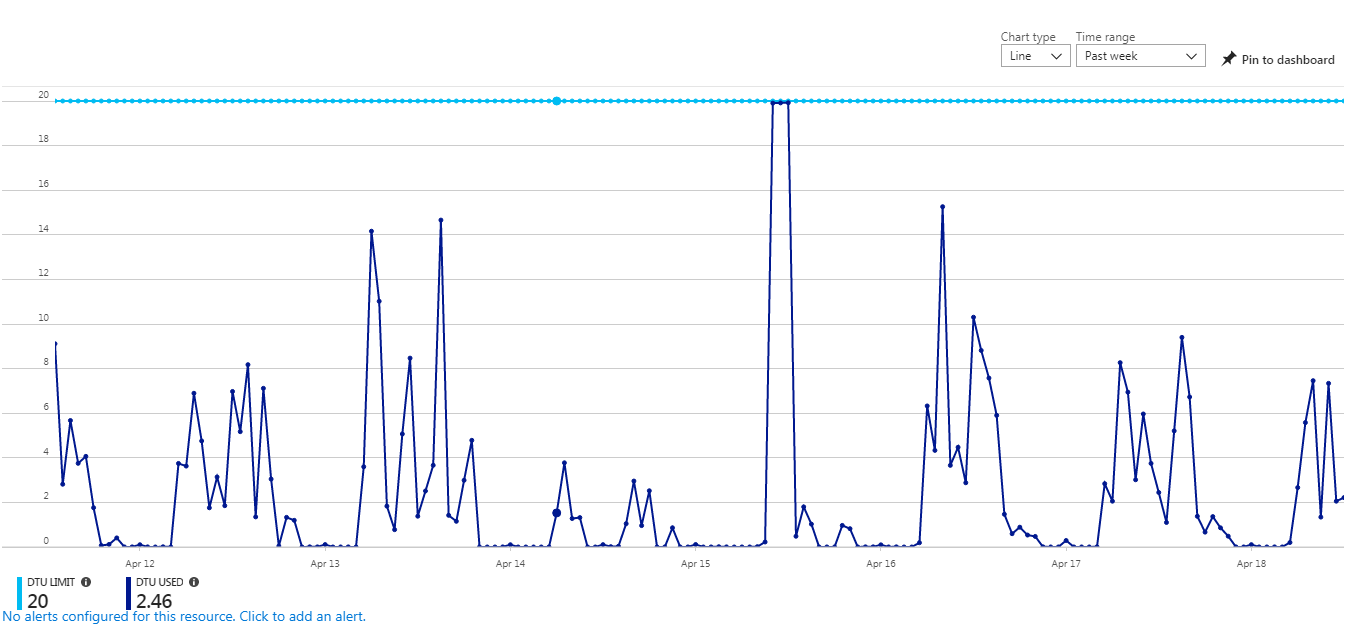
It hit the max one day, but overall, the usage level and limits seem reasonable.
One could increase the DTU level to avoid the maximum use that one day, accept the current settings, or even lower it. It depends on the urgency and value of what is running when the maximum is reached. In some cases, users may not even notice because they've launched something that they wouldn't expect to finish immediately. In other cases, it could be critical that more resources are available.
It's a classic capacity utilization question of how many power plants need to be built to make sure there's enough electricity on the hottest summer day, knowing that much of that investment sits idle the rest of the year.
While everything seems fine at the weekly level, looking at the hourly graph gave us a shock:
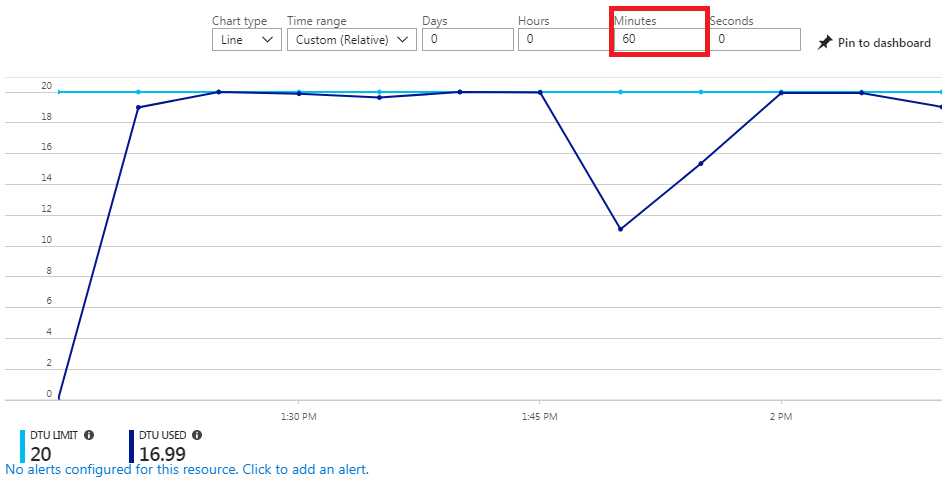
That looks bad. It looks like the database is maxed out for most of the hour. It seems conclusive that we need to increase our DTU level.
However, given that the weekly graph looks reasonable, we wanted to better understand what was happening. How often were we hitting the limit and for how long?
We reduced the time window from a week to a few days, to one day, and even a few hours and didn't see any period of high utilization similar to the one hour graph.
We finally narrowed it down to 65 minutes and saw this:
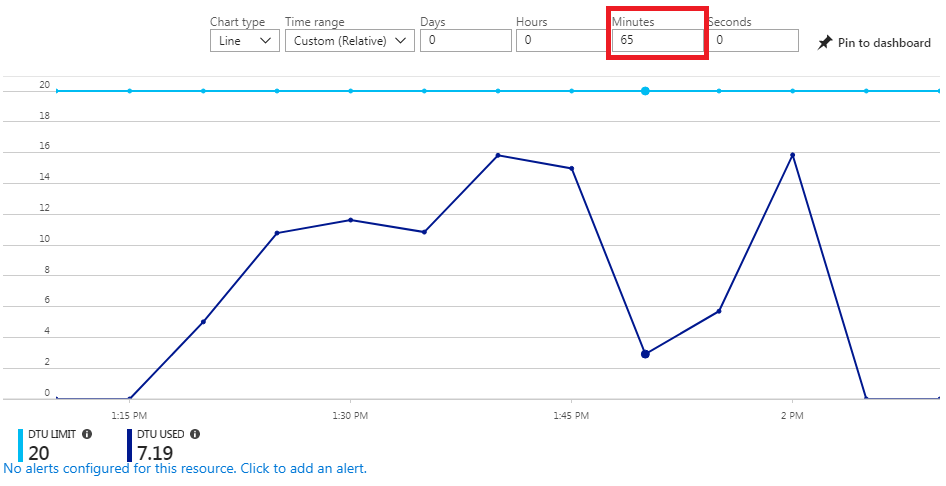
These are completely different displays of the same period of time. The 65 minute graph never hits the maximum DTU. What's going on?
With help from the Microsoft Azure support team, it turns out the data is calculated and displayed differently for 60 minutes or less versus more than 60 minutes.
- For < 60 minutes, usage is binned in 15 second intervals. Limited usage during that period could show maximum use in that interval, but does not mean it's actually being used to capacity all 15 seconds.
- For > 60 minutes, usage is binned in 5 minute intervals. A lot more queries and activity is necessary to fill up a 5 minute interval and is less susceptible to short data spikes.
By collaborating with the Microsoft Azure team, we concluded that we need to focus on the >60 minute time ranges to monitor and set our resource limits. Our resources are set at the right level for our application, and we will continue to monitor it to ensure it's adequate over time.
We hope this information helps you avoid the confusion we experienced since we didn't find any documentation explaining this distinction at the 60 minute mark.
This is one of many things we've learned over the years using and configuring Azure. Let us know if we can help you with your Microsoft SQL Server and/or Azure development efforts.
Have any suggestions or comments? Visit our Blog and leave us a reply!
Good luck!
 FMS Technical Papers
- Microsoft Azure and Cloud Computing...What it Means to Me and Information Workers
- Microsoft Access and Cloud Computing with SQL Azure Databases (Linking to SQL Server Tables in the Cloud)
- Deploy Microsoft Databases Linked to a SQL Azure Database to Users without SQL Server Installed on their Machine
- Microsoft SQL Server Express: Version Comparison Matrix and Free Downloads
- Additional FMS Tips and Techniques
- Detailed Technical Papers
Microsoft Azure, SQL Azure, and Access in Action
- Convert Microsoft Azure SQL Server Databases to SQL Elastic Pools to Share Server Resources UPDATED!
- Microsoft SQL Server Database Users and Permissions Instead of Server Logins UPDATED!
- Microsoft Azure Security Holes with SQL Server Databases
- Migrate Microsoft Access Applications to SQL Server
- Monitor and Setting Azure SQL Server Usage and DTU Limits
- Microsoft Azure, SQL Server, and Access Consulting Services
Microsoft Resources
- Microsoft Access Team Blog: Access 2010 and SQL Azure Introduction
- Microsoft Azure Site
- Microsoft SQL Azure
- Microsoft Azure Pricing Options
Strategic Overview
SQL Server Security
SQL Azure Cloud
What it Means to Information Workers
Link Microsoft Access to SQL Azure Databases
Deploy MS Access DBs linked to SQL Azure
Monitor SQL Server Usage and DTU Limits on Azure
Convert Azure SQL Server to Elastic Pools
SQL Server Tips
Database Backup and Restore on Network
SQL Server Express
SQL Server Express Editions and Downloads
SQL Server Express Automated Backups
Videos
Migrate Your Data Tier to SQL Server: Strategies for Survival
Microsoft Access Database and Migration Challenges
Are we there yet? Successfully navigating the bumpy road from Access to SQL Server
Services
Microsoft SQL Server Consulting Services
Visual Studio .NET programmers for web development
General Microsoft Access consulting services
Additional Resources
Microsoft Access Developer Help Center
MS Access Developer Programming
Connect with Us
 Email Newsletter
 Facebook
 X/Twitter

