


Total Access Statistics for Microsoft Access 97
Statistically Analyze Microsoft Access Data

Best Business Product

Best Access-Based
Business Product
"With an intuitive, easy-to-use Wizard interface and the Access Basic (or VBA) interface, Total Access Statistics
makes it easy for users or programmers to perform statistical analysis. It generates the analysis you need with output in a useful
format: tables. If you need to perform advanced numerical analysis, consider Total Access Statistics."
Access/VB Advisor Product Review
Total Access Statistics offers a wide range of statistical functions for Microsoft Access users and developers. Developed specifically for Microsoft Access, Total Access Statistics eliminates the need to export your data to other programs for statistical analysis.
Total Access Statistics is installed as a Microsoft Access Add-in and runs directly from your database through the File | Add-ins menu. Using the Total Access Statistics Wizard, you can quickly analyze your data without programming. You can analyze any Access table, linked table, or Select query. An unlimited number of records and multiple fields can be analyzed at one time. Best of all, all results are in Microsoft Access tables. View, sort, or query the results, merge it with other data, or add it to forms and reports.
Total Access Statistics can also be added to your Microsoft Access applications. If you are a developer and need statistical analysis in your database, you can by-pass the Wizard and add all the statistical features directly into your application with a simple procedure call.
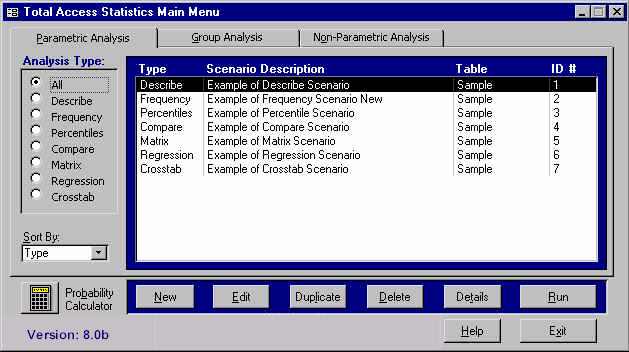
The Total Access Statistics Wizard
- Statistically analyze data from any Microsoft Access table or attached table
- Analyze multi-table select queries
- Analyze an unlimited number of records at one time
- All output is in Microsoft Access tables
- Form driven, no programming required
- Analysis selections are saved in scenarios which can be run again in the future
- Specify grouping fields to analyze groups of records separately (optional)
- Weight records based on the value in a field (optional)
- Ignore a numeric value or range of values (optional)
- Programmatic interface to add statistical analysis to your applications
- Supports Microsoft Access 2.0, Microsoft Access 95 (7.0), and Microsoft Access 97 (8.0)
Field Analysis
- Count, Missing (blanks), Mean.
- Minimum, Maximum, Range, Sum, Sum of Squares.
- Variance, Coefficient of Variance, Std. Deviation, Std. Error.
- Geometric Mean, Harmonic Mean, Root Mean Square.
- Skewness, Kurtosis.
- Mode, Mode Count.
- t-Test versus Mean (test for null hypothesis).
- Confidence Intervals (t and Normal tests). 95% and user-specified levels.
Percentiles and Frequency Distributions
- Percentiles: median, quartiles, deciles, and
percentiles.
Quintiles available in version 8.0. - Frequency distribution with user-specified group width, initial value and number of intervals. Display count, percent of total, sums and cumulative values.
Field Comparison - Compare fields in a record
- Mean difference
- Standard Deviation of difference
- Covariance
- Correlation
- R-Square
- Paired t-Test
- Probability (1 or 2 tails)
Regression
- Simple, Multiple and Polynomial (up to 9th order).
- With Y-Intercept or Zero-Intercept.
- Count, Missing, R-Square, Std. Error of Est., and ANOVA
- Coefficient analysis: P Std. Error, Beta, t-Value and Probability.
- Residual calculation for each data point.
Cross-Tabulation and Chi-Square
- 10 types: Count, Sum, Average, Minimum, Maximum, Range, Variance, Coefficient of Variance, Std. Deviation, Std. Error.
- Count crosstabs for Text and Date value fields.
- Row total and Column sub-totals.
- Percent of Column, Row and Total.
- Sorted column fields with special handling for blank values.
- Chi-Square Analysis: Chi-Square, Probability, Cramer's V, Phi-Coefficient, Coefficient of Contingency.
Group Analysis - Compare groups of records
- Two-Sample t-Tests (pooled and separate variance tests).
- ANOVA (Analysis of Variance) with sum of squares, F-Value and probability.
Non-Parametric Analysis
- One sample Chi-Square
- One Sample Sign Test for Median and Mean
- Kolmogorov-Smirnov Goodness of Fit Test
- Paired Sign Test, Spearman's Rho Correlation
- Wilcoxon Signed Rank Test for Matched Pairs
- Wald-Wolfowitz Runs Test
- Mann-Whitney U Two Sample Test
- Kolmogorov-Smirnov Two Sample Test
- Kruskal-Wallis One Way Analysis of Variance
- Friedman's Two Way Analysis of Variance
Probability Calculator
- Evaluate probability of test values: Z, t, Chi-Square, and F. Enter value, degrees of freedom and the probability appears.
- With version 8: Calculate inverse probability. Enter a probability and calculate the equivalent Z, t, Chi-Square, and F value.
- Eliminate interpolating values in reference tables.
Pricing and Availability
Total Access Statistics is currently shipping and is available in three versions based on your Microsoft Access version. Please specify which version when ordering.
This product is available as a single user license, a five-user package, or as part of the Total Access Ultimate Suite. For developers wishing to incorporate Total Access Statistics features into their applications, an unlimited runtime license is available for distributing applications to non-Total Access Statistics owners.
|
Total Access Statistics Pricing by Microsoft Access Version |
||||||
| Microsoft Access Version | ||||||
| Licenses | Price | 365/2016 | 2013 | 2010 | 2007 | 2003 |
| Single | $599 | Buy Now | Buy Now | Buy Now | Buy Now | Buy Now |
| 5-Seat | $1799 | Buy Now | Buy Now | Buy Now | Buy Now | Buy Now |
|
Upgrade Between Access Versions |
||||||
| Single | $399 | Buy Now | Buy Now | Buy Now | Buy Now | Buy Now |
| 5-Seat | $1199 | Buy Now | Buy Now | Buy Now | Buy Now | Buy Now |
|
Update to the Latest Version within the Same Version |
||||||
| Update 14.1 | 12.9 | 11.9 | ||||
| Single | $249 | Buy Now | Buy Now | Buy Now | ||
| 5-Seat | $749 | Buy Now | Buy Now | Buy Now | ||
|
Premium Support Subscription |
||||||
| Single | $299 | |||||
| 5 Seat | $999 | |||||
|
Also available as part of |
||||||
|
Total Access Ultimate Suite |
||||||
|
Runtime/Redistributable Version |
||||||
| Total Access Statistics includes a runtime library with royalty-free redistribution rights. Use is subject to the terms of the License Agreement. |
||||||
|
Licensing Information |
||||||
| Total Access Statistics is licensed on a per user basis.
Each user who runs the program must have a license. Read the License Agreement for details. |
||||||

Microsoft Access 365/2016 shipping!

Version 14.1 for
Microsoft Access 2010
Version X.9 for
Microsoft Access 2007 and 2003
Version X.8 for
Microsoft Access 2002, 2000, and 97

Reviews
"Total Access Statistics performs a wide range of data analysis right inside Access. The product includes a Statistics Wizard to perform parametric, group, non-parametric, record analysis and more. The results are placed in Access tables that you can integrate into your forms and reports."
Alison Balter, Author
Statistics Info

Additional Info


