Microsoft Access Data Normalization (Transpose) with Total Access Statistics
Designing a Scalable Solution
Having the data stored in your tables properly lets databases scale properly over time and simplifies data analysis and performance. A fundamental part of database design is to recognize that "records are free, fields are expensive". For a scalable solution, you want to make sure your system simply adds records over time and doesn't have to add new fields. Adding new fields requires changing queries, formulas, forms, reports, code, etc.
The Problem
It is common to have "spreadsheet" type data where columns get added over time. That's not a big problem in spreadsheets because one can add columns or rows without a difference. In databases, there's a huge difference and it violates the concept of data normalization.
Unfortunately, one doesn't live in a perfect world. You may be given non-normalized data or you may have created it in the past and now need it normalized. Regardless, Total Access Statistics makes it easy to transform your existing data into a normalized format without programming.
The following example illustrates how non-normalized data can be converted.
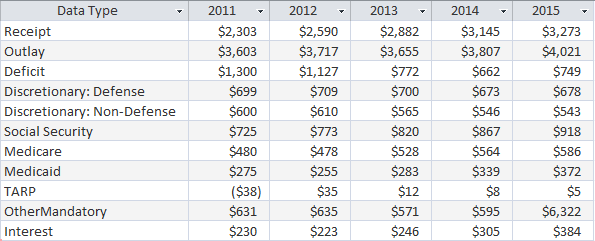
This original table stores federal budget data with a separate field for each year. This is similar to a spreadsheet. While it is easy to add a new field when a new year’s data arrives, any query, form, report, or code that uses this table would also need to be updated and retested. It would be far easier if the year were a field.

Data Source to Convert: Non-normalized Budget Data
Manually converting the data is cumbersome and time consuming, but the Normalize feature makes it easy to convert the example table to normalized format:

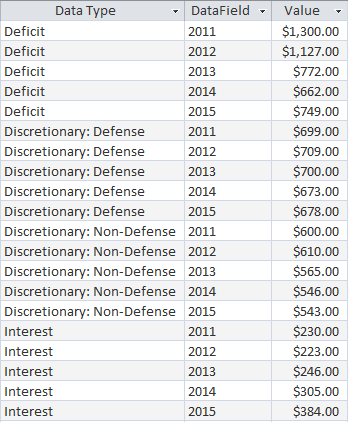
Normalized Data from Data Source
Notice how a separate record is created for each year with the ID and LedgerType fields preserved from the original record.
We'll now see how it's done in Total Access Statistics.
This is an example of the Normalize feature that's included in the sample database that ships with Total Access Statistics. It's also part of the trial version so you can run this from that as well.
After selecting the data source you want to transpose, this is the field selection screen in Total Access Statistics for the Normalize feature:
Normalize Field Selection
The Normalize Fields become fields in the output table containing the data from the data source. The type of the output field depends on the types of normalize fields that you select:
| If the Normalize field types include… | The output field type will be… |
|---|---|
| Numeric fields only | Numeric. Select the specific numeric field type (Currency, Integer, Long Integer, or Double) on the Normalize Options page. For ADPs, the equivalent numeric fields such as Float, Money, Int, etc. are available. |
| Text and numeric fields | Text. The field size is 255. |
| All text fields | Text. The field size is equal to the largest Normalize field selected. |
| At least one memo field | Memo. |
Each of the Normalize Fields is transformed into a separate record in the output table. The DataField in the output table contains the name of the field to identify the data.
After selecting the fields, press [Next] to show the Normalize options:

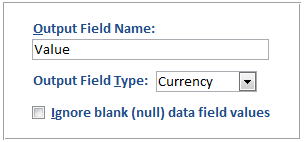
Output Field Name
The name you want in the output table for the normalized data.
Output Field Type
If the Normalize fields are all numeric, select the specific numeric field type (Currency, Integer, Long Integer, or Double) from the list. If there is at least one text Normalize field, this option is disabled, and the output field type is determined automatically.
Ignore Blank Values
If you check this option, blank values are ignored. If unchecked, a record is created even if the data is blank (null).
Results
Here are the sample results:

These are the fields in the transposed table:
| Field Name | Description |
|---|---|
| Group Fields | Group fields selected (if any) |
| Data Field | Field name identifying the data in the record |
| Value Field | Value from the Data Field |
Total Access Statistics lets you interactively generate your calculations through its wizard interface to easily select the data source, fields, and analysis without programming. After you specify your selections, they are automatically saved as a scenario in your database so you can run them again in the future when your data changes.
A VBA statistics function is also available so you can generate these results from code. You can easily run any saved scenario by calling a single procedure in the Total Access Statistics VBA library. The library includes a royalty-free runtime license so you can include it with your Access database and distribute it to non-Total Access Statistics owners.
Call the function from a button's OnClick event or other process, and the results are generated for you. You can even hide the built-in user interface so your users don't even know Total Access Statistics is running. They'll be amazed with your statistical analysis capabilities!
Here are some additional resources and details about some of the data analysis you can perform on your Microsoft Access data with Total Access Statistics:
-
 Financial Cash Flow Calculations
Use discounted cash flows and interest rates to generate Net Present Value (NPV), Present Value (PV), Future Value (FV), Internal Rate of Return (IRR), Modified Internal Rate of Return (MIRR) for periodic and date dependent payments and receipts. -
 Percentile Calculations
Calculate different types of percentiles: median, quartiles, quintiles, octiles, deciles, percentiles, every X.5 percentile, and place them in a table or update an existing field with the record's percentile value. - Running Totals and Moving Averages
Summarize a moving set of records to calculate running sums, moving averages, minimum, maximum, range, median, standard deviation, etc. - Data Normalization (Data Transpose)
Transpose non-normalized data so you can easily analyze and maintain it. - Regressions
Simple, multiple and polynomial regressions with calculation of equation coefficients, ANOVA and residual table - Crosstabs and Chi-Square
Advanced cross-tabulations with percentage of row, column and totals displayed as records or columns
Microsoft Access 2016 and 2013 Versions are shipping!
Version 14.1 for
Microsoft Access 2010
Version X.9 for
Microsoft Access 2007 and 2003
Version X.8 for
Microsoft Access 2002, 2000, and 97
Reviews
"Total Access Statistics performs a wide range of data analysis right inside Access. The product includes a Statistics Wizard to perform parametric, group, non-parametric, record analysis and more. The results are placed in Access tables that you can integrate into your forms and reports."
Alison Balter, Author
Statistics Info
Additional Info


